Interactive research · Confidential client · 2025–26
Civic Investment Map
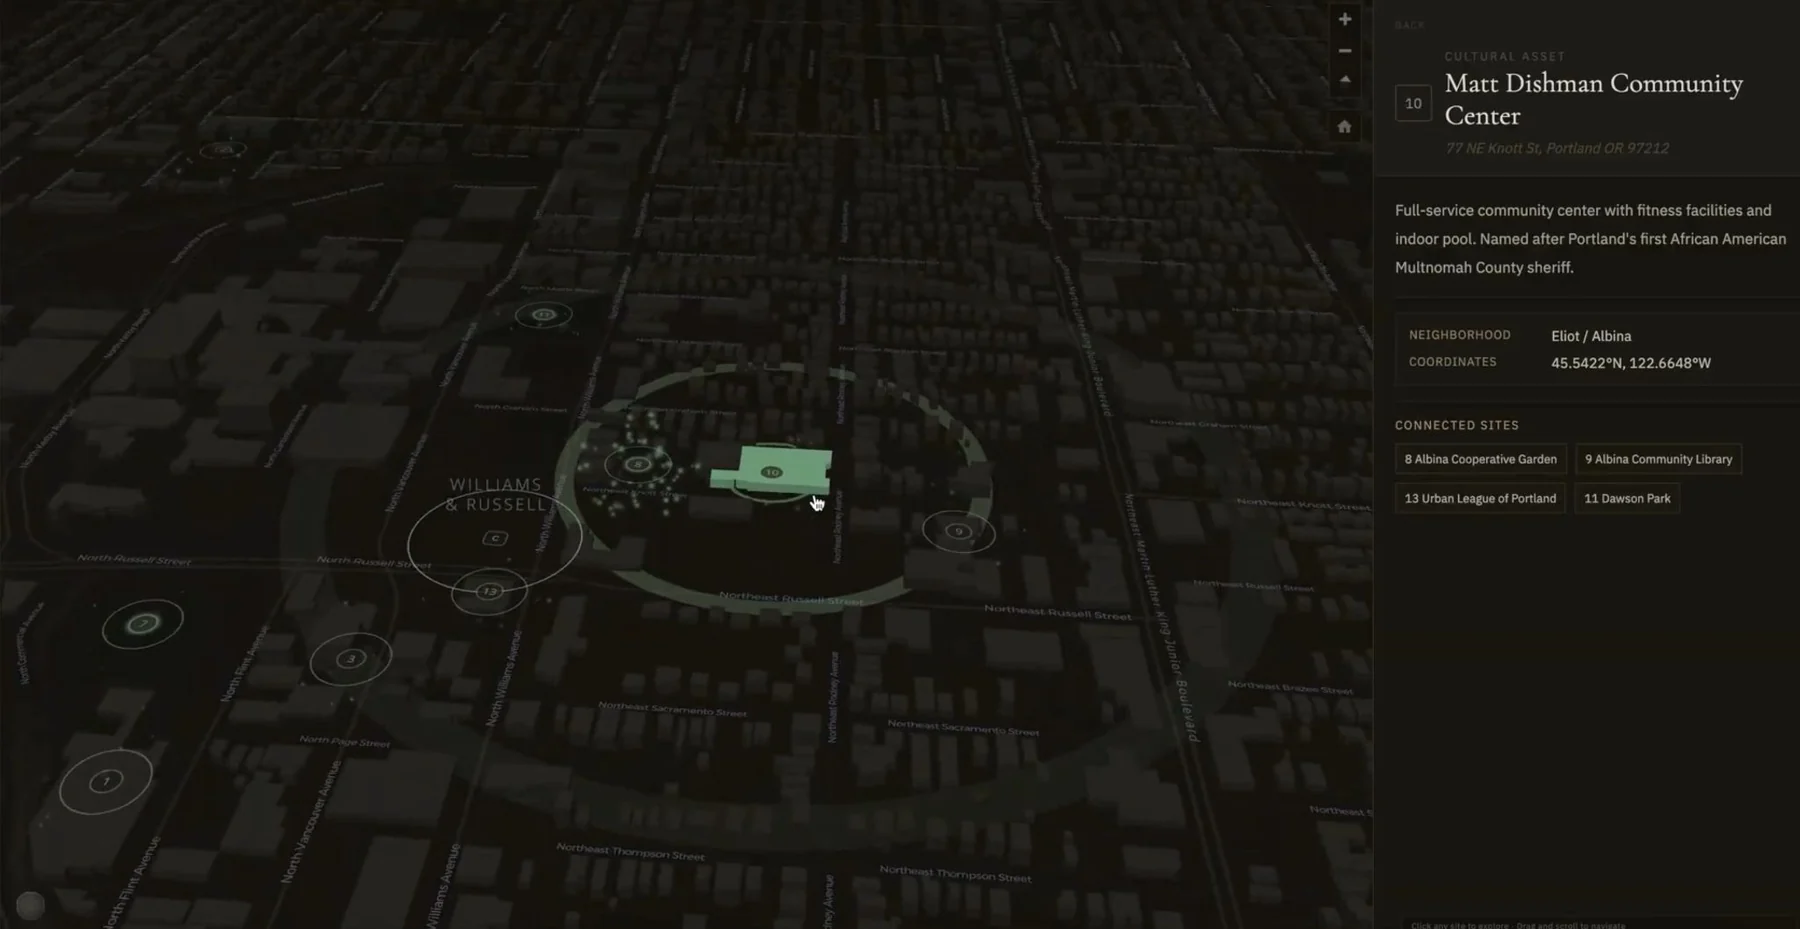
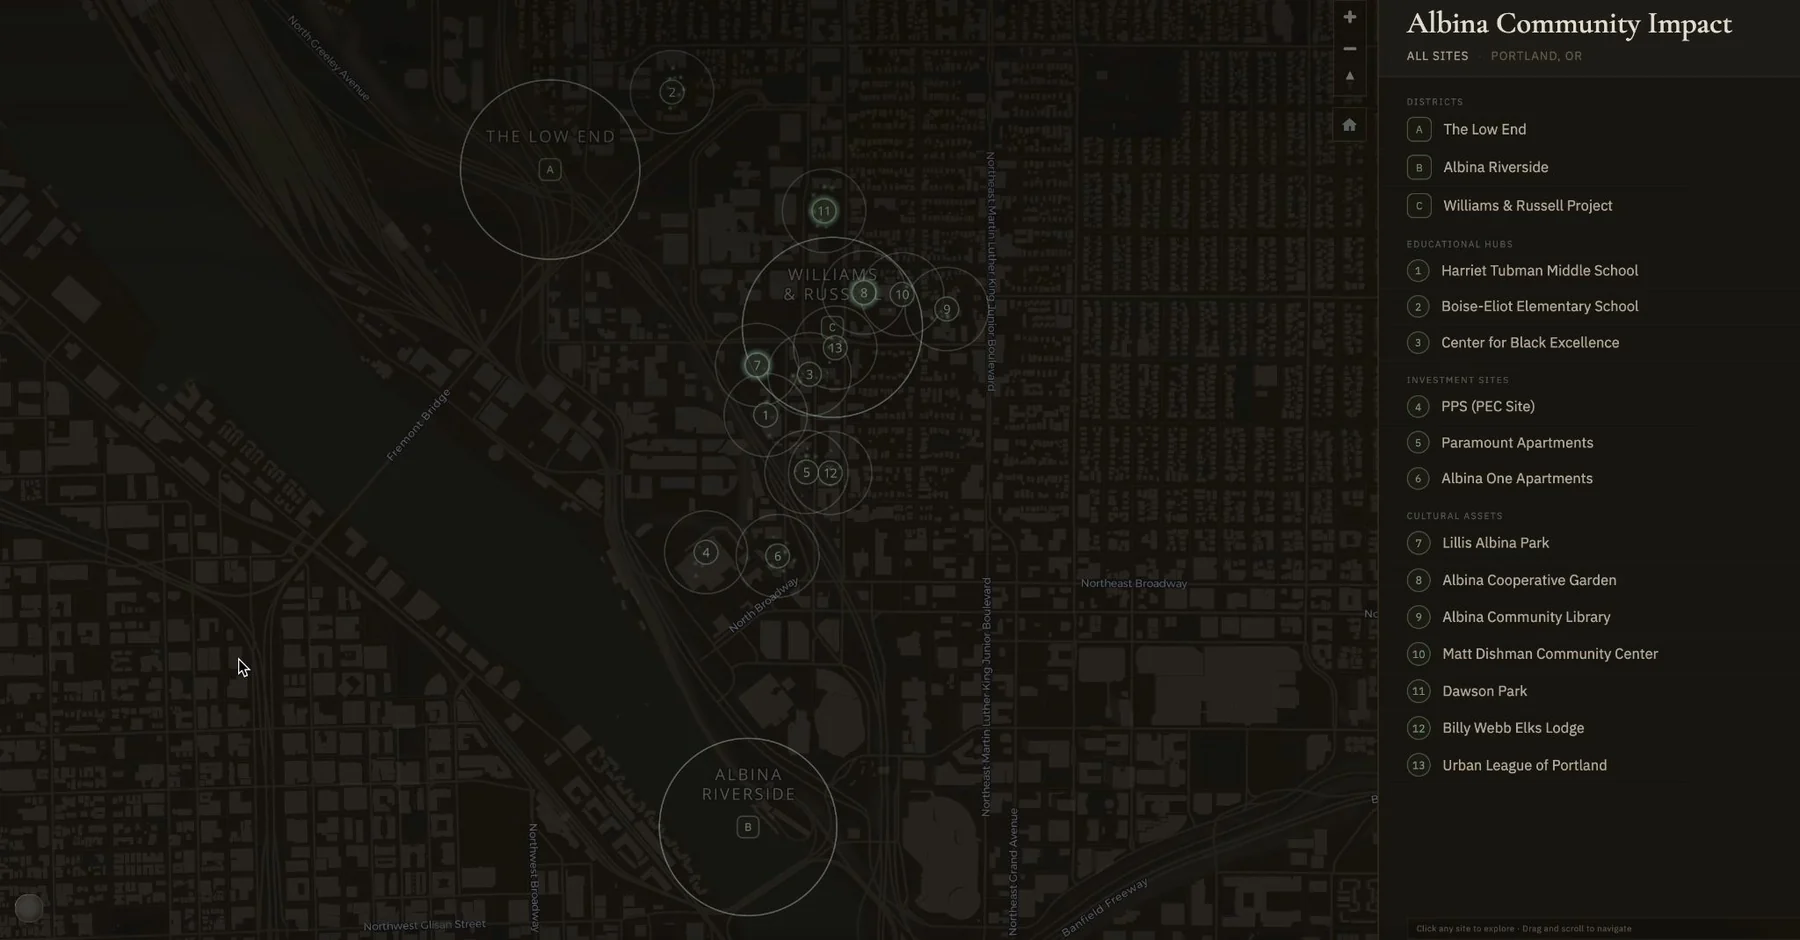
A 3D civic map translated thirteen sites, three eras, and ninety years of research into an investor-event experience.
MapLibre GL JS, terrain, building extrusions, custom WebGL layers, and a multi-phase site-selection state machine were directed through prompt contracts and iterative visual critique.
Role
UX and interaction designer · AI-directed frontend builder
Outcome
A production 3D civic narrative delivered for a live investor event on a hard deadline.
The operating story
What the system held,
and what it left human.
A parcel map is data until it carries a reason for being navigated. This interactive 3D experience connected thirteen sites to three eras and ninety years of neighborhood history, revealing detail progressively as the viewer moved between place, time, and stewardship. The production stack combined MapLibre GL JS, OpenStreetMap building extrusions, AWS DEM terrain, custom WebGL animation layers, two programmatic cartographic systems, and a multi-phase site-selection state machine. The build was directed through structured AI-agent prompting: prompt contracts, regression guards, and iterative visual critique held the interface on-model across dozens of changes. That process resembled design direction more than code generation. The result shipped to a hard live-event deadline while maintaining one evidence chain from historical research to the interaction shown on screen.
By the numbers
- 13 sites
- 3 eras
- 90 years of neighborhood history
Artifacts that carry the case
- Prompt contracts + regression guards
- Land-over-time state diagram
- Cartographic system comparison
Model the evidence
Sites, eras, actors, terrain, and narrative sources became a spatial data structure rather than a linear report.
Direct the agents
Prompt contracts and visual critique kept an AI-directed build stable across technical and aesthetic iteration.
Land the live moment
Progressive disclosure and a constrained state machine made a dense historical argument navigable under event conditions.